 |
|
|
|
|
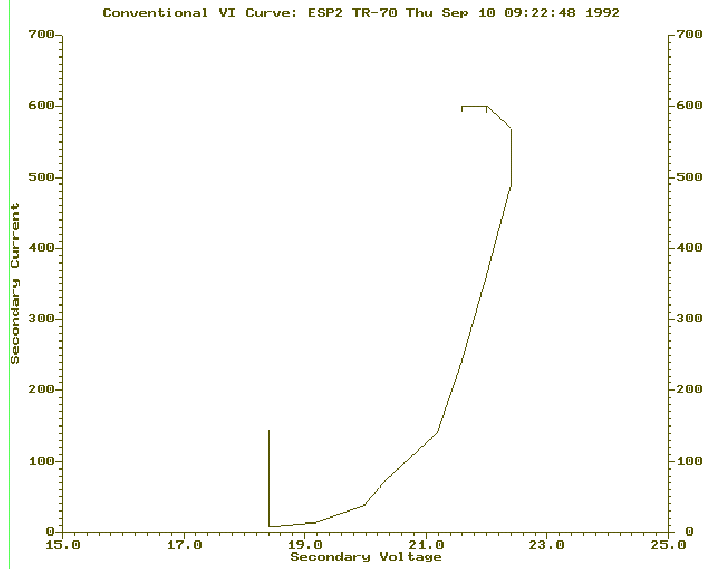
Why Dynamic VI CurvesWhenever the ESP is not operating properly the first question asked, is, have you run a Voltage Current curve or VI curve? The object being verification of a back corona condition. Briefly, back corona causes the electrical section to collect less ash as the secondary currents increase. The secondary voltage will actually decrease at higher power levels. Conventional test for back corona is to manually or automatically reduce the output of the control to secondary current threshold. From this point recordings are taken approximately every 10 ma to 50 ma steps. The recordings are plotted and signs of a secondary voltage fold back are studied. Obviously this test requires reduction in the operating level of the control, some period of time and the disturbance of the operating dust layer. 
The same test for back corona may be accomplished with out disturbing the normal operation of the field. If the half cycle wave form of secondary voltage is plotted against the half cycle wave form of secondary current, an indication of back corona and the severity of the back corona will be obvious. The back corona condition is indicated on the plot as a secondary loop at the peak of
the secondary current and voltage. The larger the loop the greater the control is operating in the back corona condition. Reducing power to the control will reduce the secondary loop till it disappears, indicating operation in a normal range. Past Automatic High Voltage Controls did not possess the ability to process each of the signals in a digital format fast enough for providing waveforms or dynamic VI curves. As an added benefit of Digital Signal Processing, Waveforms of primary voltage and current and secondary voltage and current may be pulled from memory and displayed. |
| ||||||